Excess rentals in TfL bike sharing
We often use TFL bike rides, but the frequency with which varies on various factors. Lets pull the data from TFL and examine the variance in the bikes hired from the expected monthly and weekly rentals.
Let’s pull the TFL data from their data repository, and perform EDA on this.
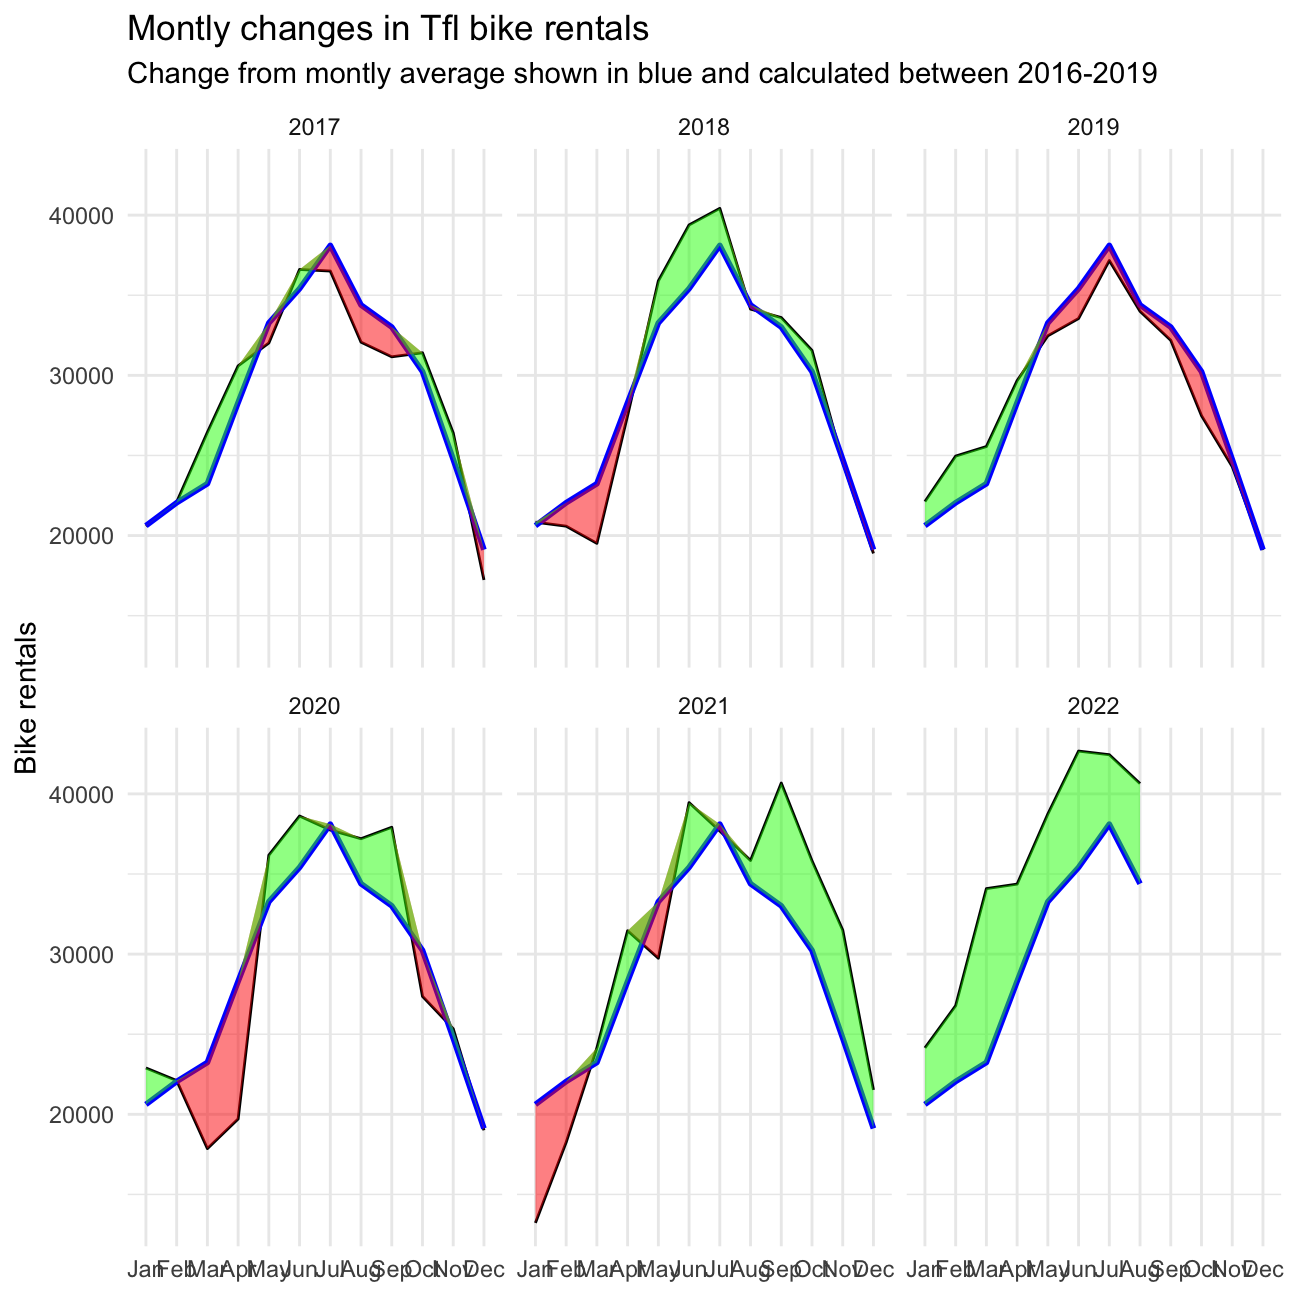
Let’s examine how the graphs looks like for the monthly bikes hired from 2017 to current year in comparision to the average bikes hired from 2016 to 2019, which acts as our expected rentals parameter.
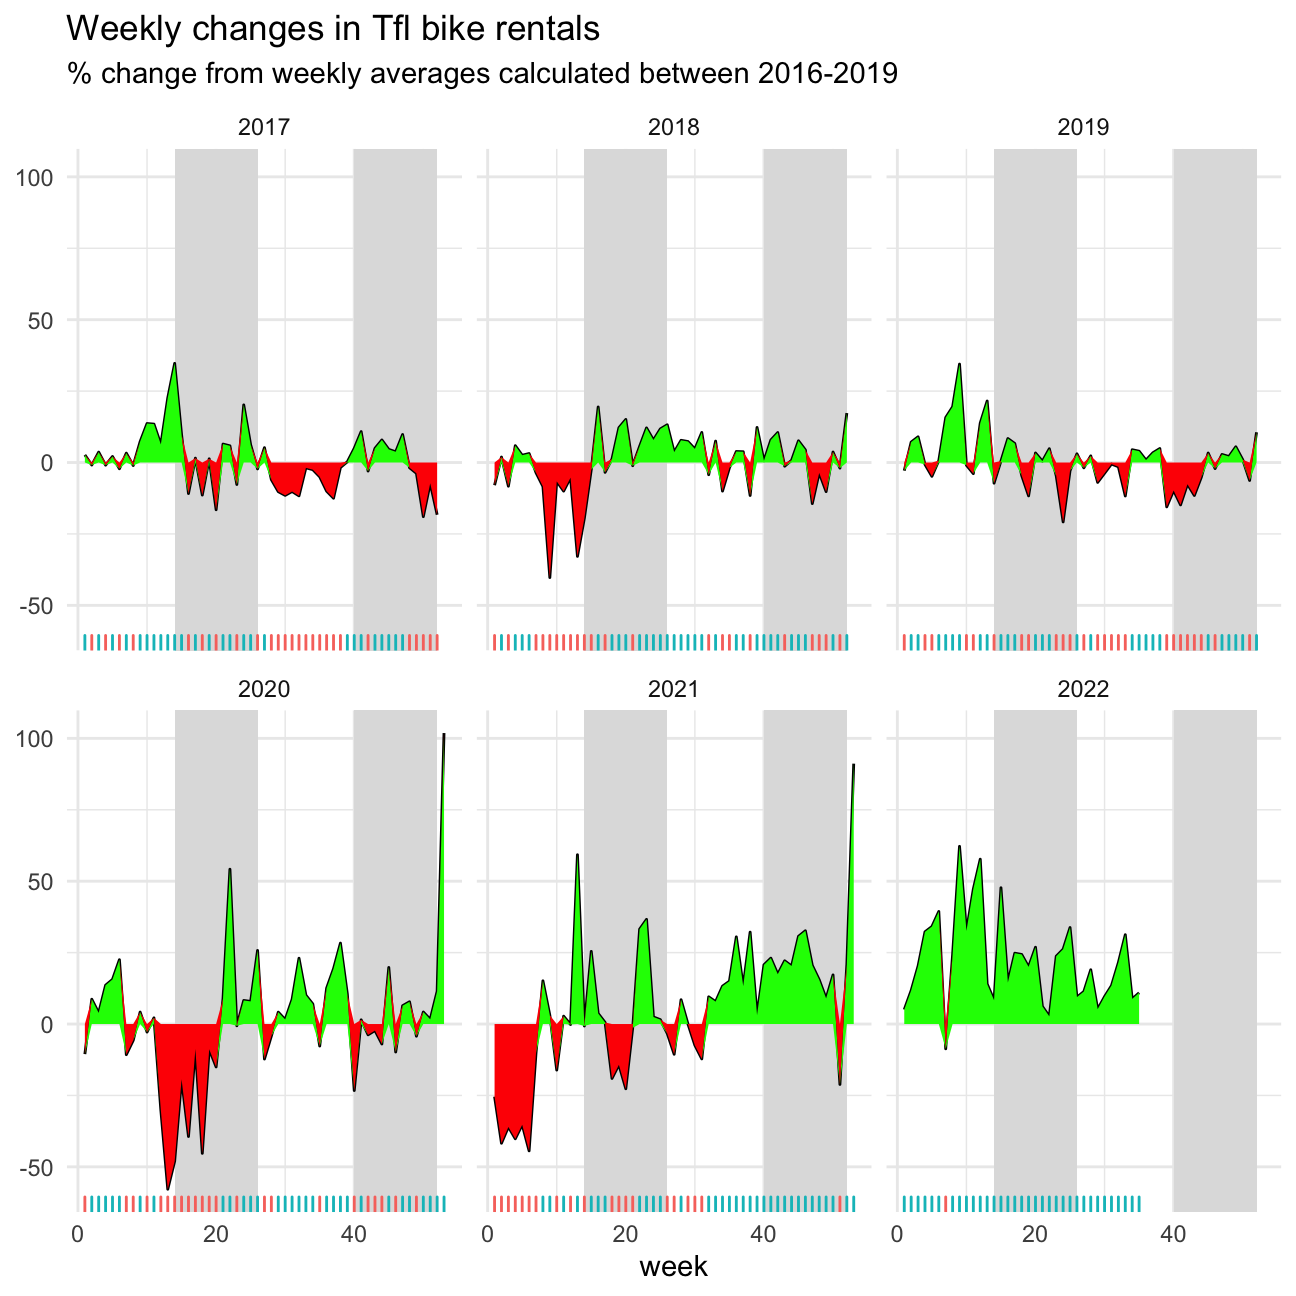
Now, let’s examine the percentage changes from the expected level of weekly rentals.
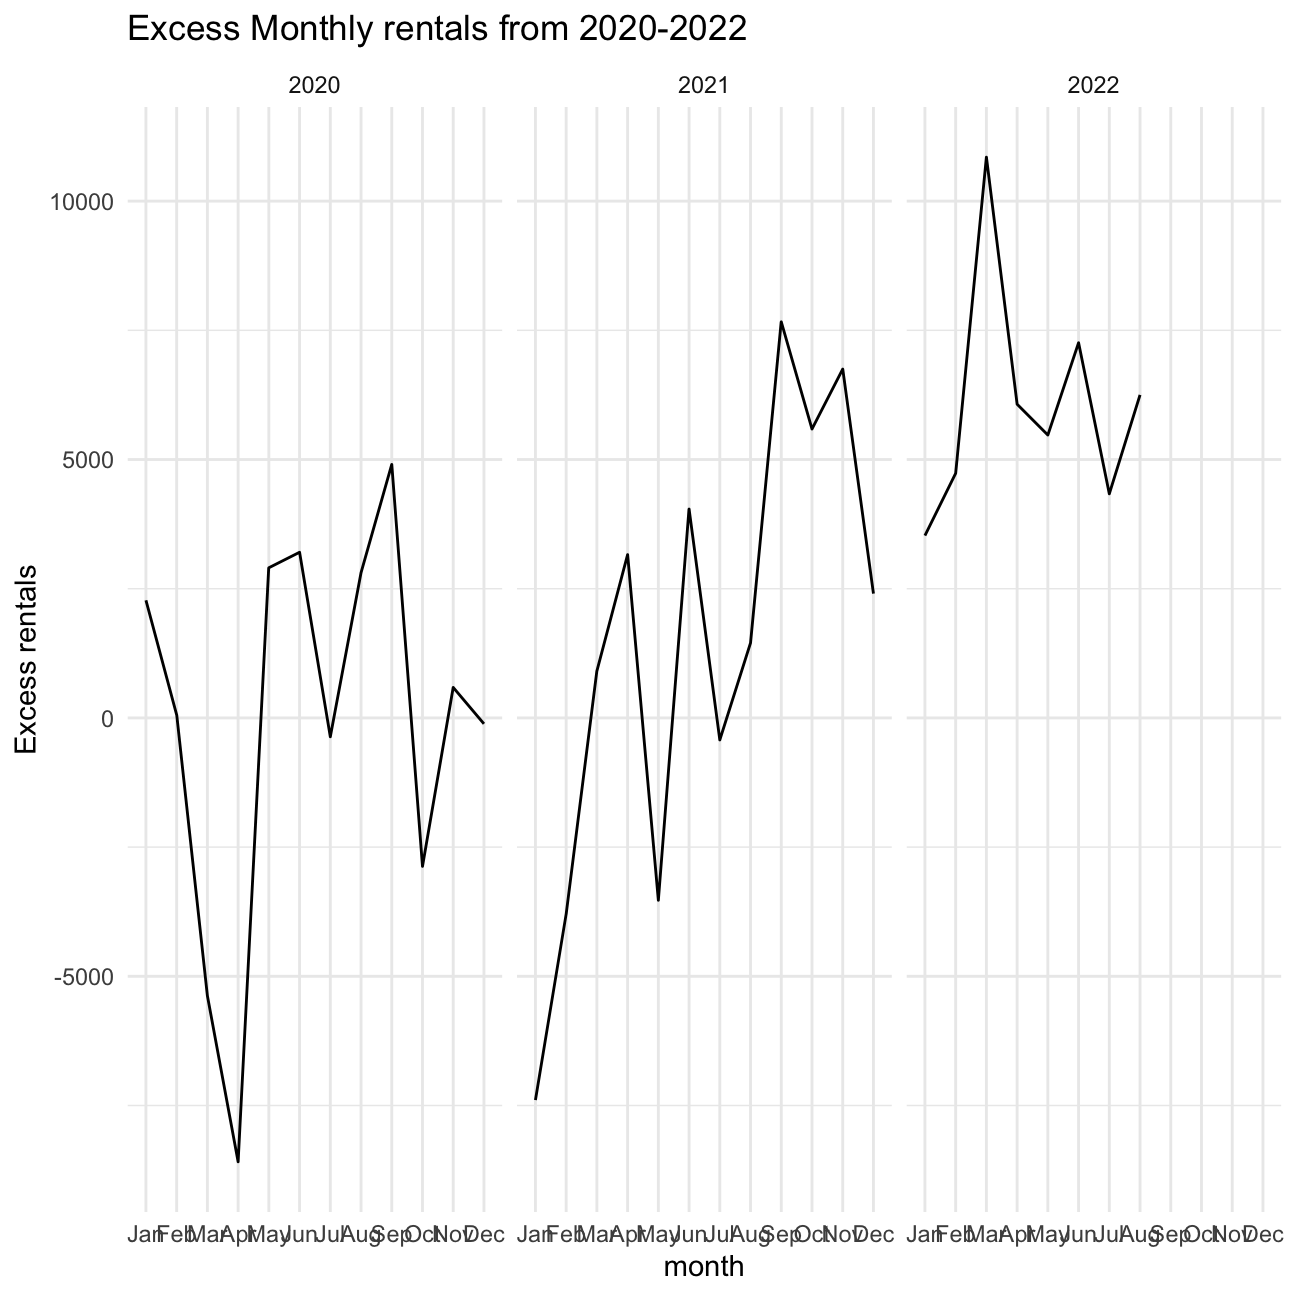
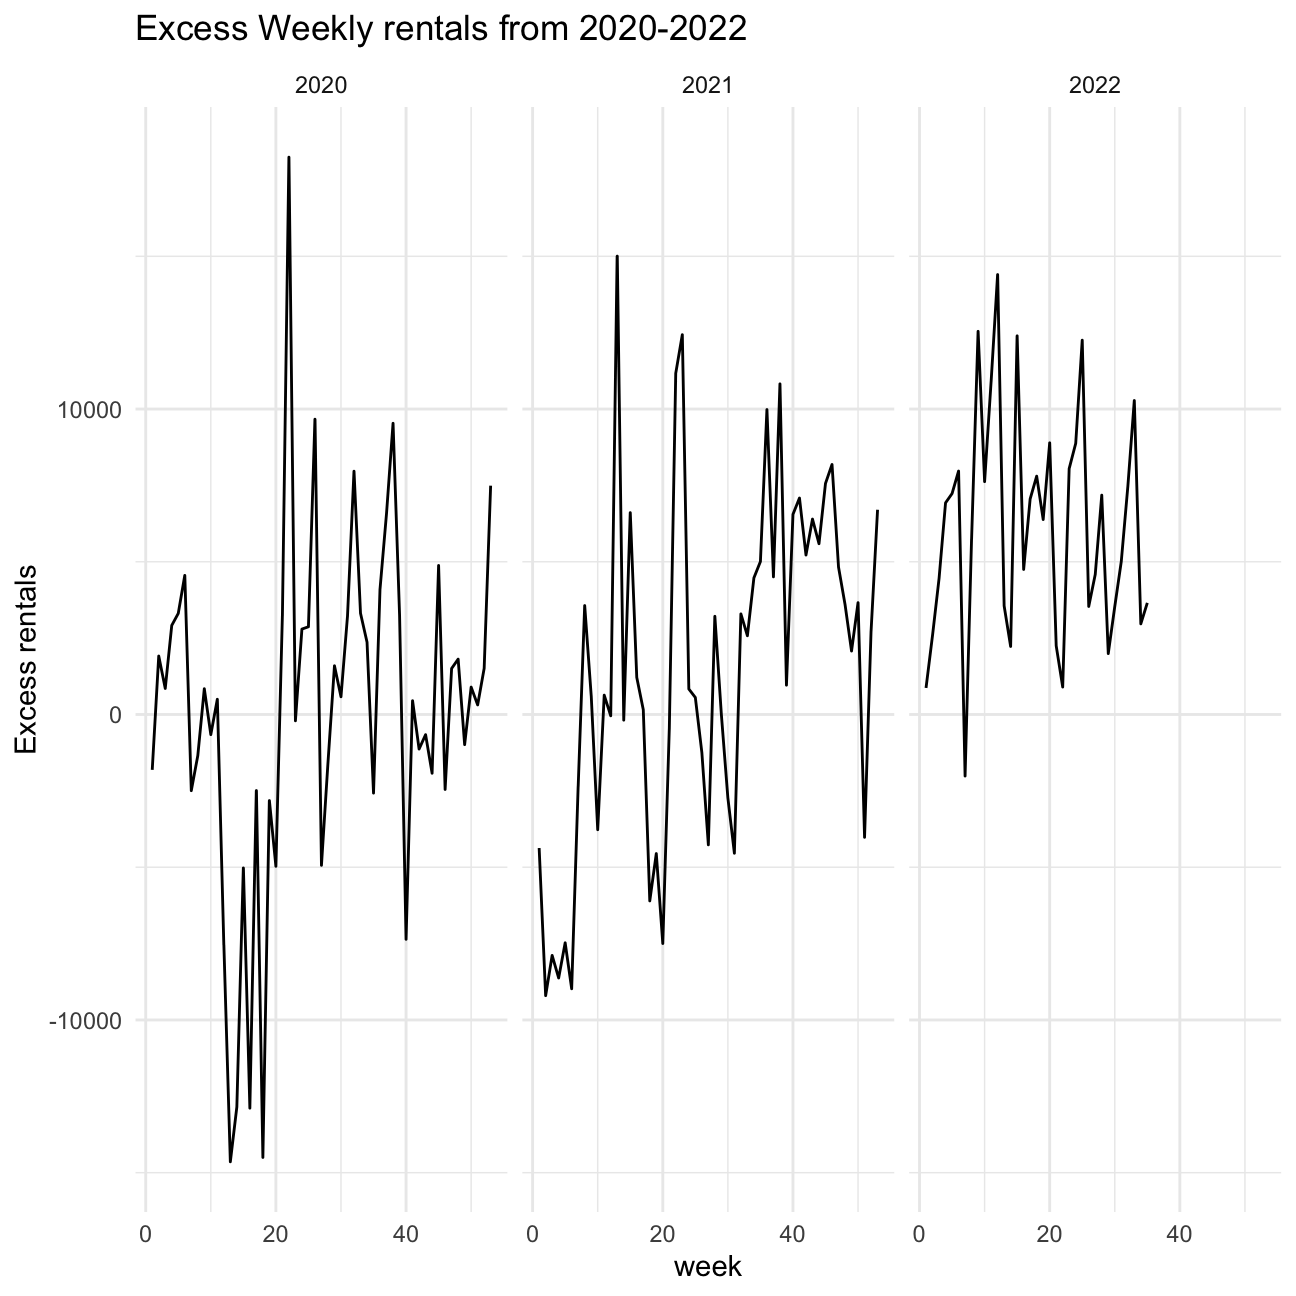
For both of these graphs, let’s calculate the expected number of rentals
per week or month between 2016-2019 and then, see how each week/month of
2020-2022 compares to the expected rentals. Think of the calculation
excess_rentals = actual_rentals - expected_rentals.
You might wonder, why we took mean as our expected rentals parameter rather than a median. As the data from 2016 to 2019 is uniform, mean can be used for the expected rentals calculation. But in presence of any outliers, as the year 2020, it’s much more efficient to take median in the expected rentals.