GDP components over time and among countries
Let’s look at the GDP data from the United Nations’ National Accounts Main Aggregates Database, which contains estimates of total GDP and its components for all countries from 1970 to today. At the risk of oversimplifying things, the main components of gross domestic product, GDP are personal consumption (C), business investment (I), government spending (G) and net exports (exports - imports).
We will look at how GDP and its components have changed over time, and compare different countries and how much each component contributes to that country’s GDP.
First Let’s load the data and tidy it. Let’s compare the GDP changes for United States, Germany and India.
Firstly, let’s see how each GDP components has changed for these 3 countries since 1970.
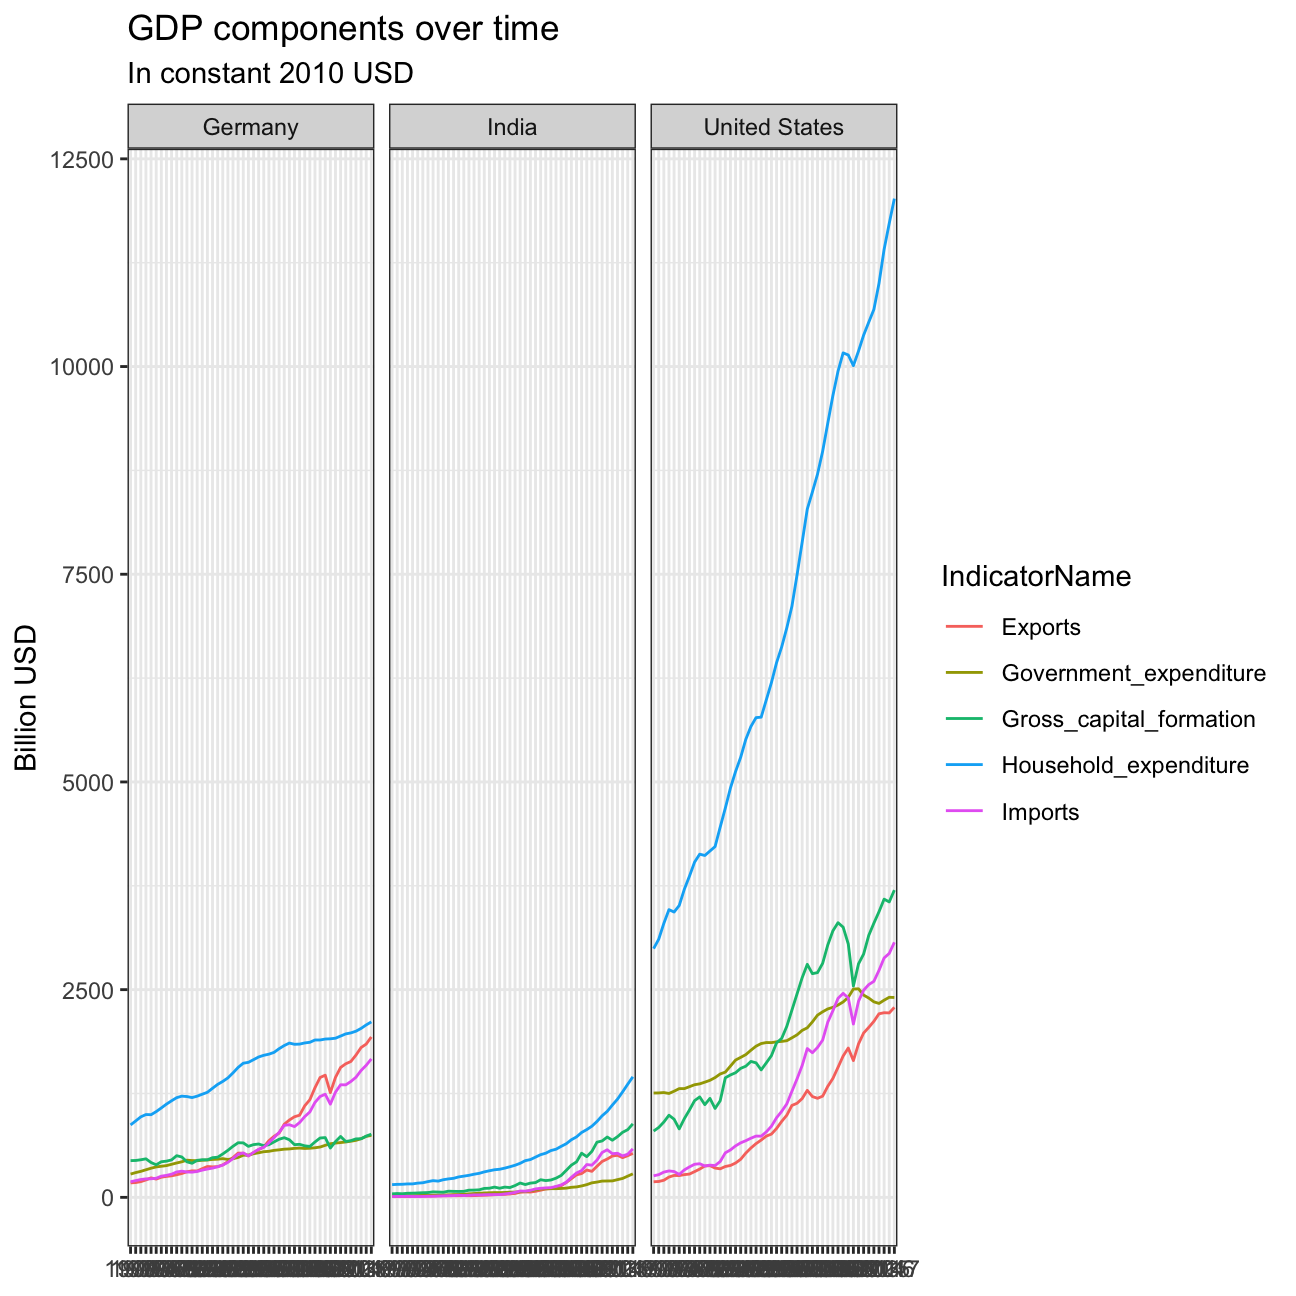
Now, let’s compare the GDP and its breakdown at constant 2010 prices in US Dollars for United States, India and Germany.
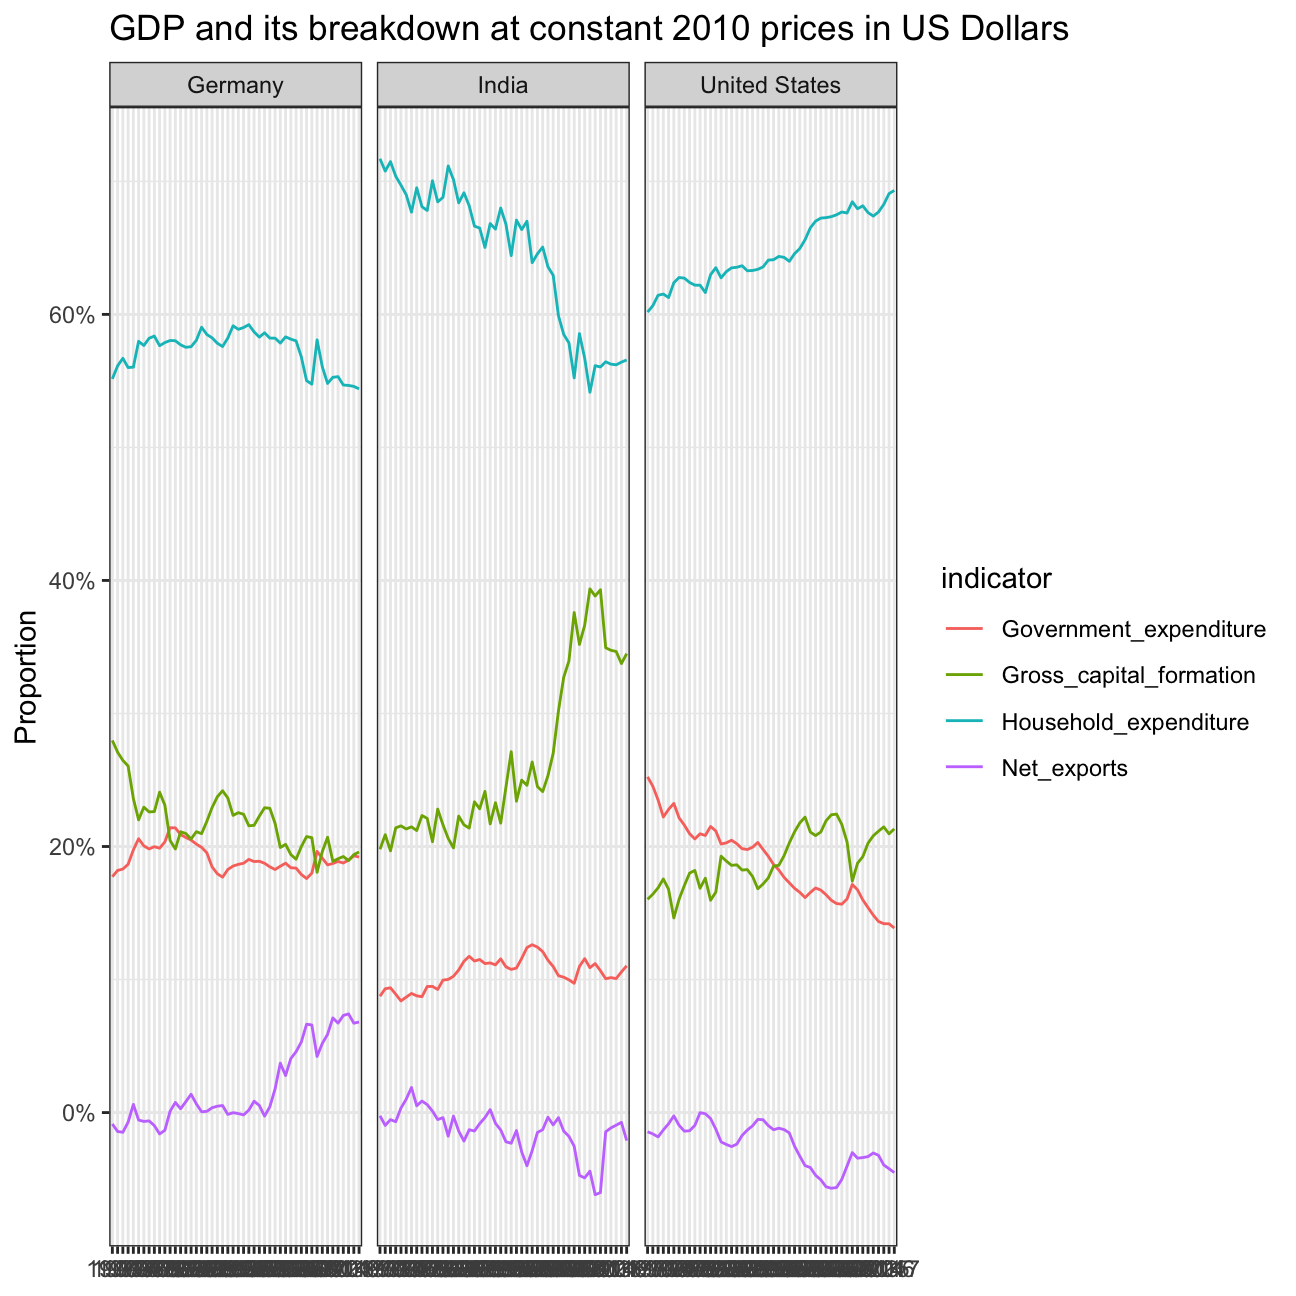
These are our observations from keenly observing these graphs for United States, Germany and India.
In Germany, the only GDP component that has been growing for the past 20 years is net exports. This indicates that German economic growth is fueled by exporting more than importing. Government expenditure is relatively stable. This indicates that the government isn’t investing heavily in the moment, which is sadly true and which explains why Germany is very backward in terms of internet access and future technology adoption (like 5G networks). Gross capital formation (also called “investment”) has been going down lightly for the past 50 years, indicating that German businesses don’t invest as heavily as they used to. Relative German household expenditure has been stable. This makes sense when considering that the German population isn’t growing, it is rather shrinking and only an immigration influx has been stablilizing it.
The chart looks very different for India. There, relative household expenditure has dropped from around 70% in 1970 to around 55%. In the same time period, gross capital formation has been going up by 15%. This indicates that Indian companies are investing heavily at the moment. Furthermore, government expenditure has been mostly stable at around 10%, which is half as much as Germany. The frugality of the Indian government probably stems from the fact that India is not yet as highly developed as Germany. Interestingly, net exports has been mostly negative in the past 50 years. This indicates that India is reliant on imports from other countries because they import more than they export.
In the US, the component that is growing the most is household expenditure, now at about 70%. In Germany, this is currently only 55%. This indicates that the US economy focuses more on producing for their own population compared to Germany focusing a bit more on exporting goods. This makes sense as the US market is extremely strong. In addition, the US have negative net exports, currently at around -5%. Relative government expenditure has been decreasing, from around 25% in 1970 to around 15% in 2016. In Germany, this value is at around 20% in 2016. This indicates that the US isn’t investing heavily at the moment, growth rather stems from household expenditure.